Another year has passed, and another generation has gone through the National Assessment, and the results have been published on evaluare.edu.ro.
I managed to find the time to download the data, update the maps with the fresh information, and, as usual, I am publishing them together with a short analysis, as I have done in previous years.
At first glance, there are no major changes. Pretty much everything I wrote in the first edition of the 2021 analysis of schools in Bucharest and Ilfov remains valid today. There were no significant changes compared to last year’s edition either.
And on a personal level, we still live in Chiajna, and we face the same problem when it comes to choosing a school for our child. We still have a year before a decision has to be taken…
Going back to the maps, the methodology used has remained the same – the markings, colors and philosophy behind them are the same. The data source is, as last year, evaluation.edu.ro. For maps we used:
- simple marker for primary and secondary schools;
- a round marker with a square in the middle for colleges (grades 5-8 plus high school);
- a round marker with a dot in the middle for religious and bilingual schools.
As in previous years, we have not included arts and crafts or special schools on the map.
As for the marker colors, we kept the color palette from previous years:
- blue – primary schools
- green – average over 9.01
- yellow – averages between 8.01 and 9
- orange – averages between 7.01 and 8
- red – averages between 6.01 and 7
- dark red – average under 6, category “God forbid”
This year we made two changes: one cosmetic – harmonizing the names of schools with those in the official tables; and one more significant – including the number of students who graduated the National Assessment exam as well as those who were absent. I will do the same in the years to come.
This change gives a clearer picture of the impact of the demographic decline, which is starting to be felt also in the evaluation results. Unfortunately, there is a worrying trend: fewer pupils, declining results and a concentration of problems in peripheral and rural areas.
You are currently viewing a placeholder content from Google Maps. To access the actual content, click the button below. Please note that doing so will share data with third-party providers.
More InformationOverall, the results seem to have returned to some normality. After the period of large variations during the pandemic and the years immediately following, this year there were no noticeable differences from 2024. The most significant changes are in the area of schools that underperformed last year, some of which managed to move up a category, maybe even two.
As far as state schools are concerned, the situation is relatively constant: most grades between 9 and 10 come from national colleges, but many of them have very small numbers of graduates – some with 21, 28 or 29 students. When you have one class of “Olympians”, good results are predictable. But there are also big schools with excellent results – one example is Secondary School 79, with 211 graduates and an overall average of 9.01. This is a remarkable performance.
Between these extremes we find the “normal schools”, with 60-80 pupils, where hard work is visible.
The geographical distribution of performance unfortunately remains uneven. Poorly rated schools are mainly on the outskirts of the city – with small exceptions such as the Dudești-Timpuri Noi area. These low-performing schools also generally have very few students: we find schools with only 15, 17 or 22 graduates in Bucharest. In Ilfov we found nine schools with less than 10 graduates each.
In densely populated areas such as Drumul Taberei, Militari, Berceni, Ștefan cel Mare or Dorobanți, the numbers are more balanced – around 70-90 pupils per school, and the results are generally better.
Ilfov, on the other hand, remains an area with serious educational problems. Although there are some schools that have made visible progress, moving from ‘disastrous’ to ‘acceptable’, the number is small. In many localities around Bucharest we find strange situations: schools very close to each other – sometimes 2-3 km from each other – operate as separate entities, each with 15-20 students. It is hard to understand why they are not merged, especially in the context of limited resources.
No school in Ilfov managed to get an overall average above 8. The best result belongs to Buftea Secondary School No. 1, with a school average of 7.90 and 141 graduates.
Private schools in 2025
In private schools, there are some new developments compared to previous years. More and more of them are completing the secondary cycle with a full set of graduates, allowing them to appear for the first time in the rankings with colored markers. Surprisingly, many of these private schools have excellent results – averages between 9 and 10 or between 8 and 9 – but with one important caveat: almost all of them have very small classes of 2, 4, 6 or 30 pupils at most. That often means one class.
I found, for example, a private school with only one graduate with a 7.95 average. It’s hard to imagine what the educational process looks like in a school where you’re the only student in the class…
A notable exception is the International Theoretical High School of Computer Science in Bucharest, with 243 graduates and a high school average of 8.79 – a figure comparable to that of large public schools.
You are currently viewing a placeholder content from Google Maps. To access the actual content, click the button below. Please note that doing so will share data with third-party providers.
More InformationAll in all, there are no dramatic changes in the educational landscape compared to last year, but some trends are becoming more pronounced: the depopulation of schools in the suburbs, despite real estate developments in these areas. The race for good schools continues, with the differences between the center and the periphery becoming more pronounced. Ilfov County is stagnating. The presence of private schools in the overall landscape is growing. It remains to be seen how these issues evolve in the coming years.
A bit of statistics
As I still have the results files from Bucharest from last year, I did a quick comparison between the two sessions of the National Assessment.
In 2024, 16,566 students sat the exam and 194 were absent. In 2025, the number of students in attendance increased to 17,307, with 220 absent. That’s an increase of 4.47% on the previous year.
As usual, the mother tongue exam was taken by a small number of students. In 2024, 🇩🇪 152 pupils took part in German, 🇮🇹 56 in Italian and 🇭🇺 14 in Hungarian. In 2025, the figures were slightly different: 🇩🇪 180 pupils for German, 🇮🇹 68 for Italian and 🇭🇺 only 6 for Hungarian.
In terms of the top of the rankings, in 2024 there were 4,102 averages between 9 and 10, of which 32 were averages of 10. In 2025, the number of averages between 9 and 10 rose to 4,976, but only 29 of these were averages of 10.
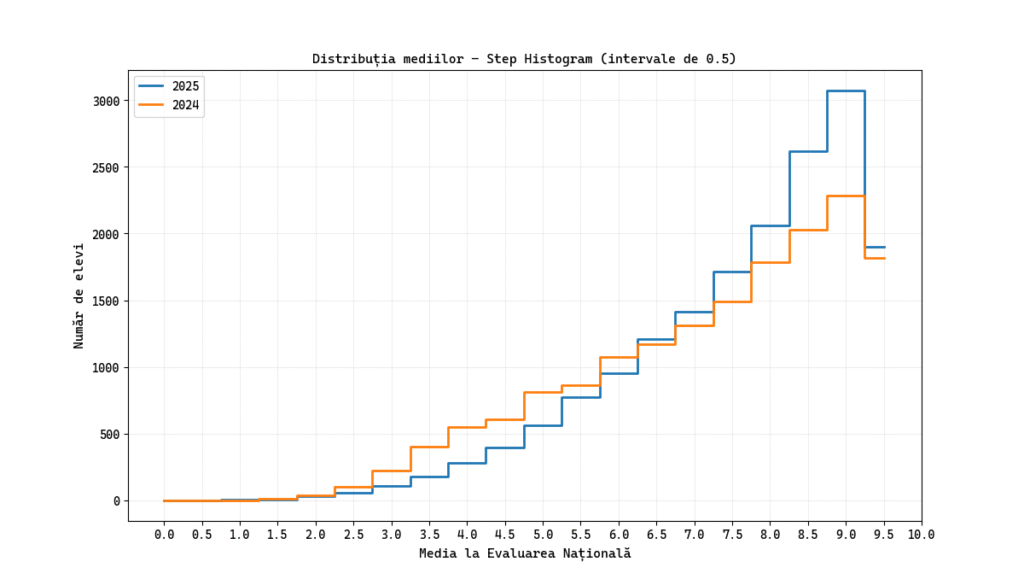
This rise in high averages is not necessarily a cause for celebration. While these scores may tickle parents’ egos, in practice they make it more difficult for the allocation algorithm to separate candidates. In the case of top high schools, this crowding at the top leads to fierce competition, where even a high grade may no longer be enough for a desirable place – leaving very good students on the sidelines.
This is best seen by comparing the 2024 and 2025 grade distributions. To illustrate the differences, I have chosen to use a step histogram in my graphs, which better highlights the overlaps between years and allows a clearer visual comparison. The first histogram I show is the histogram of the entire set of grades – all the averages obtained by students in Bucharest each year.
I find it interesting to look separately at the 8-10 grade range, because that’s actually where the most intense competition for a good high school enrollment is. So I’ve generated a second histogram, zooming in on just this segment – just to get a better understanding of what the competition for places at the most sought-after high schools looks like.
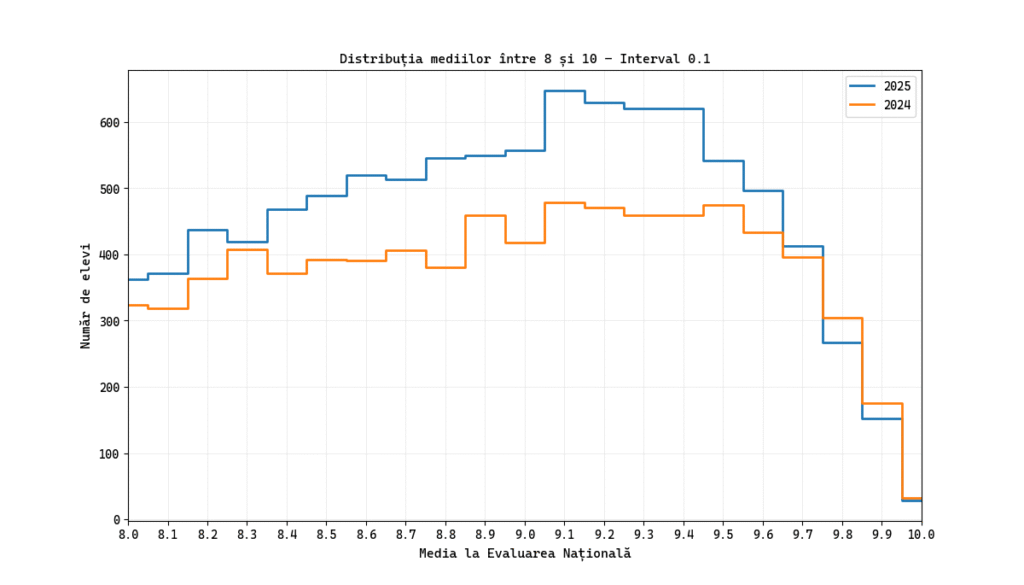
Looking at this histogram, we observe a high density of means in the range 8.35-9.75, with a clear peak between 9.05 and 9.65. Compared to the previous year, the distribution of high grades has shifted slightly upwards, which significantly complicates the sorting process in this crowded area. In contrast, averages above 9.75 are slightly fewer than last year, and the number of averages of 10 has fallen slightly. The competition will be extremely tight in the 9.1-9.75 range, where the high concentration of candidates with similar results means that small differences will be decisive in the admission process to top high schools.
Looking overall, the 2025 results seem to indicate an increase in performance, but this is most likely due to more accessible subjects than in previous years. This relative ease has led to a concentration of students in the upper end of the grades, especially between 9.1 and 9.75, where the pressure of admission becomes suffocating. Rather than helping to make a clear-cut cut, candidates are squeezed into a very tight range, where differences of a few hundredths can make the difference between a place at a top-performing high school and one at a lower-performing one.
With all these statistics in mind, you will have to consider the reality of this ‘squeeze’ in the top grades. Even with very good averages, the line can become unpredictable. I don’t think it would be a bad idea to include a more modest high school on your list of options, but one that you choose – not one that is imposed by the system. It’s better to end up in a decent, desirable and controlled place than to be randomly assigned
Last but not least, it is important to remember that in the current context, it is the position in the ranking that counts more than the grade itself. A high school where last year’s last admission average was 9.50 might this year have a last average of 9.60 or even 9.70, precisely because of the general increase in grades. That’s why it’s essential to look not just at your average, but where you are in your current ranking. Compare this position with the distribution of last year’s grades – which you can also find on the website evaluation.edu.ro – and see how the grade would correspond to last year’s context. Then take a look at what high schools were entered with that GPA the previous year.
We have to accept that, in the end, the final decision belongs to an algorithm. It’s not just about averages and preferences, it’s a numbers game – a mechanism that needs to be well understood and, as far as possible, used to your advantage. The more you get into his logic, the more likely you are to get closer to what you want. Good luck!